A Deeper Look at the Yield Curve Inversion Problem
The 3 month and 10-year treasury yield curve remained inverted for the second consecutive trading day on Monday. How much do we need to worry about this?
When news items hit the market, they tend to have their biggest impact right away, as investors and traders react to their first sighting. Even though the difference in rates between the 3 month and the 10-year yield on U.S. treasuries increased from 2 basis points on Friday to 3 on Monday, Friday produced a big selloff, where the major indexes were mostly flat Monday.
The Dow actually put in a slight gain of 0.06%, with the S&P 500 and the Nasdaq dropping 0.07% and 0.08% respectively. None of this is very significant either way, and seems to indicate that the skittish investors have bailed and cooler heads are starting to prevail.
The amount of the market losses on Friday was actually a bit concerning at least, as this should not have been marked as any kind of meaningful event, at this point at least, with the 10-year slipping a mere 2 basis points below the – month for just a single day. 4 basis points 2 days in isn’t that meaningful either for that matter, and it seems that cooler heads have prevailed, in a similar fashion to how the Fed meeting last week was greeted by the market.
We need to realize, when we take account of this inversion, that it is not the 3 month that has been moving lately, it’s the 10 year, and people are investing more in 10-year treasury bonds right now to spur these drops in yield. Yield moves inversely to price with bonds, so when the yield goes down, this means that the price they are trading at is rising, meaning more demand.
When bond yields continue to go down, this means that the demand for them isn’t tempered by price in the way we would expect, where higher prices should lower demand due to new buyers having to settle for a lesser return overall. When the demand keeps rising in the face of rising prices, this may help bond traders, but those who are buying them with the plan to hold them do see their yield reduced.
Some may wonder what this has to do with the price of stocks, and the connection here isn’t so much that the longer-term yields are lower than the shorter-term ones, even though this is can be interesting enough in itself, it’s rather the threat that there may be momentum created in the bond market which may more substantially draw money out of the stock market and into the bond market.
Bond Yields Are Influenced by a Number of Things
Declining bond yields, and increasing bond prices, can be spurred on by a number of different things. We do want to be careful not to read too much into this inversion, and especially not see this as a sign of an imminent recession. When we actually do get a recession, and even when one is approaching, people do move money from stocks to bonds, but that’s not the only reason bond prices go up.
This can also happen when people move out of foreign bonds into treasuries, something that is clearly going on now. We’re seeing a lot of European money being put into U.S. bonds these days, which doesn’t involve taking any money out of the stock market at all. Bond traders, who buy things like 10-year treasuries to speculate on the price rising, tend to buy a lot more when price momentum moves up, and these bonds are highly leveraged so this money comes a lot more from borrowing it rather than it being displaced from other assets.
Central banks also buy U.S. treasuries, not just the Fed but other central banks as well, and U.S. treasuries continue to be the gold standard here. People may also take money from other assets such as CDs and put them into bonds, and people in other countries may do so in order to benefit from a strong dollar compared to their domestic currency. As a rule, a stronger dollar will mean an upward influence on bond prices due to their being more attractive from a foreign exchange perspective.
Of the two measures, the 3 month and the 10 year, falling yields on the short-term paper is more indicative of a looming recession than what people think that the 10-year should pay out. The 3-month is therefore more proximate, and if it goes down quite a bit, we could at least reason that the bond market thinks that the economy is moving the wrong way over this period of time.
That might matter, but whether they think that this will happen 10 years from now or not isn’t particularly important to those who are wondering whether they should sell their stocks right now. At best, this might tell us that we’re headed towards a recession several years from now, but that’s not the time frame that we should care about with our stock positions, nor would it make sense to.
The problem with looking at an inversion such as the 3 month and the 10 year is that it doesn’t distinguish between what may be happening with each term, and each tells its own very distinct story. The fact that the 3 month is holding steady lately actually tells us that the bond market does not think that we’ll get a recession during this time, and 3 months out is plenty of time for investors, who are close to selling, to be able to time their exits if being on the brink of a recession is the criterion.
Even though there is a correlation here with the 3 and 10, where this does mean that we may be more prone to a recession, this does not absolve us of looking to examine the other conditions present, such as which is the one moving, or anything else pertinent to the discussion, such as a lot of people loading up on bonds that has really little or nothing to do with American stock markets.
Looking at Yields Can Be Helpful, But Only When Looked at Properly
There are also more things to look at when it comes to treasury yields than just this particular yield comparison. Yields can provide at least some insight as to where the economy may be going, independent of economic forecasts, and we can start with the 1-month and go from there. 10 years is just too long of a time period to be very useful in looking to predict things a few months ahead.
It never really makes much sense to look beyond a few months in timing exits from stocks, because these are all essentially predictions, and as long as the shorter-term predictions are fine, we don’t even need to look at the longer-term ones as the shorter-term ones would trump them.
If you were told for instance that things look rosy for the next 3 months or the next year but people aren’t so sure about 2029, it would not make sense to sell now when things are going good just because you’re worried about things far off in time.
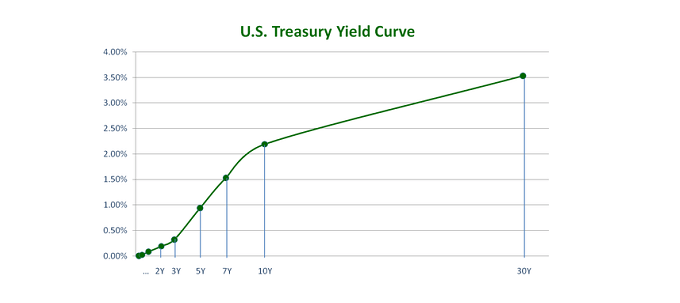
We also need to take account of the magnitude of change that these predictions may involve. For example, as of Monday, the 1-year is now at 2.47, the 2 is at 2.47, and the 3 yields 2.46. We might think, whoops, there’s an inversion with the 3-month, and maybe even smell a recession. This actually would represent a risk of a bit of a slowdown at least, in comparison to the 3 month and 10 year which tells us basically nothing in itself in the current situation, but we’re only talking 1 basis point here.
So perhaps we’ll see growth drop a little over the next 3 months, and that’s actually expected anyway, but how much of a difference would this make? If we were at the gate to recession, with growth at zero, this may put us 1 basis point underwater, but even then, this is not a very meaningful amount, either in real terms or in terms of change.
We’re still in the 2’s though, and we know that we’ll be going down from here, but if the forecasts are right at least, not anywhere near zero in 2019 or in 2020 and 2021 as well. This also does not account for any possible Fed action to stimulate the economy if things slow down more than expected, but we do know that they are happy enough to leave all of this alone right now.
Why this inversion often makes sense to heed is because we usually see the 3-month tanking, with the 10 year as the benchmark where things may have gone too far. It just doesn’t make sense to use it the other way though when the 3-month yield is stable, as things stand now, because instead of measuring the short-term outlook, we’re trying to measure the long one, which tells us basically nothing about right now or anytime soon.
The market will do what the market does though, and if this means getting off the bus without a good enough reason, that’s what will happen. A few people got off the bus Friday, but the migration from this news looks like it is petering out, as these things tend to do anyway.
Treasury yields can indeed provide us some useful information even if we just invest in stocks, However, we need to not only understand both what to look at but how to interpret its meaning properly. Looking at a single inversion as people are doing now might seem to be meaningful an even ominous to some observers, but in this case, there are no convincing reasons to do anything but brush it off as not even worthy of our attention.

Editor, MarketReview.com
Robert really stands out in the way that he is able to clarify things through the application of simple economic principles which he also makes easy to understand.
Contact Robert: robert@marketreview.com
Topics of interest: News & updates from the Federal Deposit Insurance Corporation, Retirement, Insurance, Mortgage & more.